|
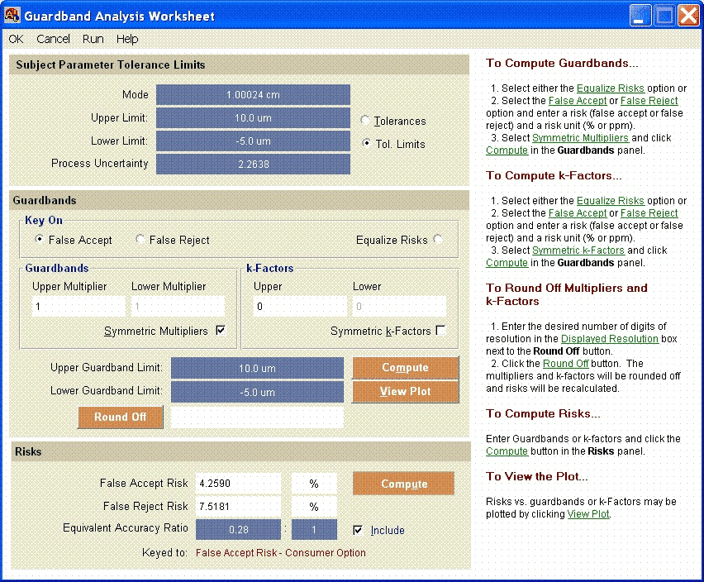
Guardband
Analysis Worksheet Features
On occasion, you will encounter false accept or false reject risks that are unacceptable, but can't be sufficiently improved by increasing in-tolerance percentages. This is a common occurrence when working with subject parameters whose accuracy is close to what is achievable with the current state-of-the-art.
In such cases, false accept or false reject risk can be reduced by setting "acceptance" limits or "test" limits either inside or outside the subject parameter tolerance limits.
The question is, how far inside or outside the tolerance limits should the test limits be set?
You can answer this question by using the Guardband Analysis Worksheet,
which is activated by selecting Guardband from the Main
Screen Options menu or clicking the guardband icon on the Toolbar. The Guardband Analysis Worksheet results can be implemented in the Main Screen risk and equivalent accuracy ratio calculations by placing a check mark in the Include box on the Main Screen. If implemented, guardbands are included in printed AccuracyRatio reports and are automatically included in Summary File records.
The four methods for setting guardbands
are described below. The display resolution for the guardbands and
risks can be adjusted by entering the desired number of digits of
resolution in the Displayed Resolution box and clicking the Round
Off button.
Direct Entry
Entering a guardband or pair of guardbands sets new test limits for acceptance or rejection of a subject parameter.
Entering or changing a limit causes the associated k-Factor to change.
The k-Factor indicates the number of multiples of the total measurement
process uncertainty (sigma) that the guardband limit lies inside or outside a parameter's tolerance limit.
For instance, a k-Factor of 1.0 places the guardband one sigma inside the tolerance limit. A k-Factor of -0.5 places the guardband one-half sigma outside the tolerance limit.
Entering or changing a k-Factor causes a change in the associated guardband.
To see the effect of a guardband change on false accept risk, false reject risk and equivalent accuracy ratio, Update button.
Compute Guardbands
Guardbands may be computed to achieve a desired level of false accept or false reject risk (if feasible).
This method only applies to symmetric guardbands, so the Symmetric Multipliers
box in the Guardband Multipliers section of the worksheet must be
checked. For this method, you have the option of keying on False
Accept, False Reject or Equalized Risks. Once the appropriate option
has been selected, the guardbands are computed by entering the desired false accept or false reject risk and the appropriate units (% or ppm)
in the Computed Risks section of the worksheet and then clicking the
Compute button. If the risk is feasible, an appropriate set of guardbands will be computed.
Compute k-Factors
k-Factors may be computed to achieve a desired level of false accept or false reject risk (if
feasible) using the same procedure as described above for computing
guardbands. The only difference is that the Symmetric k-Factors box
is checked.
Use the Guardband Analysis Plot
Guardbands may also be determined graphically using the Guardband Analysis
Plot screen, which is activated by clicking the View Plot
button. This method only applies to symmetric guardband multipliers,
so the Symmetric Multipliers box in the Guardband Multipliers section of
the worksheet must be checked first before opening the plot
screen.
For
this method, you have the option of plotting False Accept Risk only, False
Reject Risk only, or both. A plot of Risk
versus Guardband Multiplier is generated by entering the starting and ending values for
the guardband multiplier and the number of points to be plotted (up to
11) and either pressing the enter key or clicking the
Plot Graph button.
|

 AccuracyRatio 1.6 - Guardband
Analysis Worksheet
AccuracyRatio 1.6 - Guardband
Analysis Worksheet